IoT Energy Management: Use Cases, Architecture, and Implementation

- What Is IoT Energy Management?
- IoT Energy Management Use Cases
- How an IoT Energy Management System Works
- Ready-Made IoT Platform or Custom Energy Management Solution?
- Challenges of IoT Energy Management and How to Solve Them
- How to Implement an IoT Energy Management Solution
- Example From Our Work: Battery and Solar Monitoring Platform


The energy sector is going through one of its biggest shake-ups in the last 50 years right now, driven by rising global electricity use from the growth of AI and by traditional resources running thin. According to the International Energy Agency (IEA), global demand for electricity will grow by 30–60% between 2020 and 2050.
Growing demand also comes with a bigger need for better monitoring and management of energy assets. Energy systems are getting harder to run with traditional monitoring tools alone, since commercial buildings, industrial facilities, and utilities all run complex, spread-out energy systems that need a full shift toward smart grids, where IoT energy management plays a key role.
But IoT isn’t a magic fix that automatically cuts your energy bills. Its real value depends on what your organization actually needs to track, what equipment is already in place, how the data gets handled, and whether the system can actually affect day-to-day operations.
In this guide, we’ll go over practical use cases for IoT energy management, explain how the technology works, compare different ways to roll it out, and lay out the steps for building your own solution.
What Is IoT Energy Management?
IoT energy management means pulling data about energy production and use from connected devices, then using that data to monitor, predict, and control things. The devices themselves can be anything: a smart meter at the main intake, a temperature sensor on a motor, a controller on a solar inverter, you name it. The meter just gives you a number. The system built around it adds the context: where, when, and why.
In practice, here’s what that looks like: the system pulls information from the devices themselves (meters, sensors, smart thermostats, inverters, batteries, and so on). That data then gets sent to a gateway or a cloud platform, where it’s processed, stored, and turned into something you can actually look at.
To understand how the system works, it helps to think of it as three levels, one feeding into the next:
- Monitoring – shows you energy use, equipment status, and historical numbers.
- Forecasting – estimates what’s coming next, like tomorrow’s consumption or how much a solar plant will produce.
- Control – this is where it actually does something: sends commands to connected equipment based on schedules, operating rules, or outside conditions.
To make this concrete, take a cold-storage warehouse as an example. Monitoring will show that the compressor runs more at night than during the day. Forecasting will tell you how much energy you’ll need during a heat wave. And control can shift the freezing cycle to hours with cheaper rates, as long as the chamber stays within its temperature range. Most projects start with the first level and add the rest once it’s clear what’s actually being measured and why.
Worth pointing out: the Internet of Things (IoT) doesn’t replace your BMS or EMS. It works alongside them instead. A building management system (BMS) handles heating, ventilation, and air conditioning (HVAC), lighting, and access control. An energy management system (EMS) collects and analyzes energy data for a site or a company. IoT adds more measurement points, makes it easier to hook up older equipment, and moves the analytics to the cloud. And where the BMS already gives you the data you need, there’s no point setting up duplicate sensors.
IoT Energy Management Use Cases
IoT for energy management can show up in buildings, manufacturing sites, renewable energy installations, and power grids. What it actually looks like depends on which assets you’re tracking and what decisions your team needs to make.
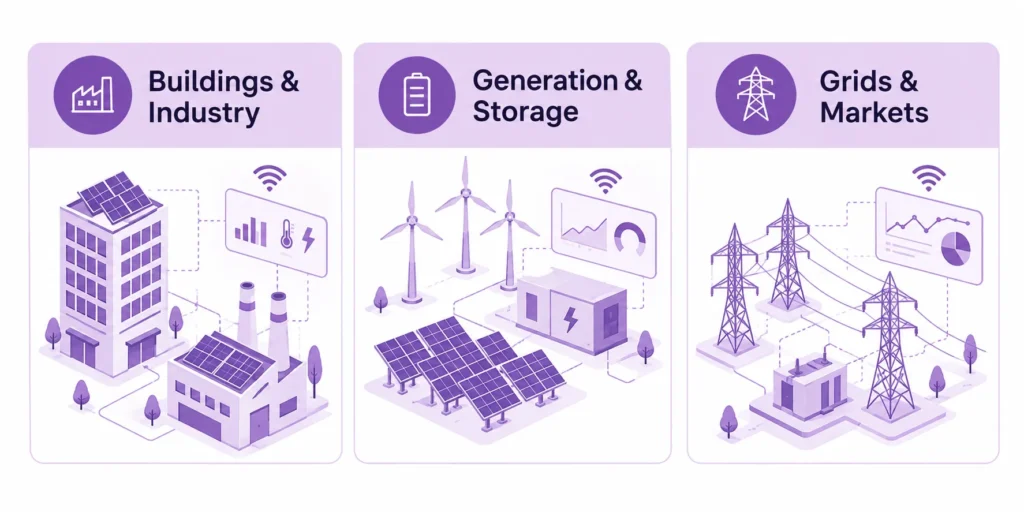
Here are eight practical use cases worth looking at.
1. Smart Building Energy Management
Traditional BMS setups in commercial buildings, hotels, or hospitals already run plenty of systems that drive energy use: HVAC, lighting, elevators, hot water, and electrical equipment. IoT extends what they can do by adding extra meters and sensors, giving you a much closer look at specific zones and equipment.
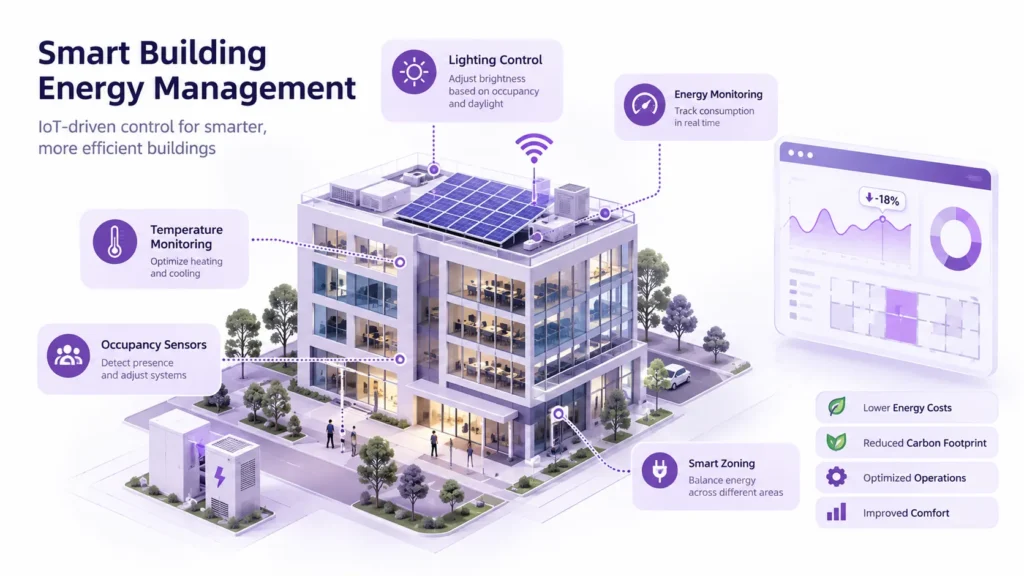
For example, smart thermostats and occupancy sensors can help adjust heating or cooling based on whether rooms are actually being used. Sub-meters let you break down electricity use by floor, department, or equipment group, instead of relying on one single number for the whole building.
A building energy management system can use this information to:
- Compare energy consumption across different zones;
- Identify equipment operating outside scheduled hours;
- Track HVAC performance and indoor conditions;
- Detect unusual electricity consumption;
- Adjust selected settings according to occupancy or operating schedules.
Compatibility is the main thing to check here. Before adding any IoT devices, it’s worth finding out whether your existing BMS already gives you the data and control interfaces you need.
2. Industrial Energy Management
In manufacturing, energy use is tied closely to what’s actually happening on the production floor. A plant might run compressors, motors, pumps, refrigeration units, furnaces, and production lines, each with its own operating pattern. One electricity bill only gives you the big picture and the overall cost trend. It can’t tell you which processes are eating up the most energy, or when energy is being wasted.
IoT-based industrial energy management, meaning individual meters on a line, a machine, or a compressor, gives you visibility right down to the equipment or production-line level.
You can connect the numbers you collect to shift schedules and production data, which helps operations teams dig into questions like:
- Which machines draw energy even when they’re sitting idle?
- Does energy use change from one shift to another?
- Are certain production lines less energy-efficient than expected?
- Does equipment draw more energy as its condition gets worse?
- How does energy use relate to actual output volume?
Worth flagging here: comparing electricity use without factoring in production volume can lead you to the wrong conclusions. That’s why linking it to production data matters so much.
A solid approach to managing energy use in manufacturing is tracking energy per unit produced, as long as your data lets you actually run that calculation.
Industrial energy platforms can also integrate with enterprise resource planning (ERP) software, manufacturing execution systems (MES), and existing energy management systems (EMS).
You might be interested in our article “ERP vs. MES: Key Differences and When to Extend Your Existing ERP”
3. Predictive Maintenance for Energy-Intensive Equipment
Predictive maintenance on equipment costs way less than replacing it, that part’s obvious. But the standard maintenance schedules manufacturers recommend are based on typical operating conditions, and they can’t account for overload, voltage spikes, or other real-world factors.
That’s exactly the gap IoT sensors fill. They feed back condition data on things like temperature, vibration, current, pressure, and running hours. The software can then check those readings against historical patterns and flag the maintenance team the moment something looks off.
That’s the foundation of predictive maintenance.
Machine learning can add another layer on top of that, by spotting patterns in large historical datasets. But it doesn’t replace an engineer’s judgment. How good the predictions are depends on where the sensors sit, how consistent the data is, the equipment’s history, and whether you’ve actually got decent failure records to work from.
4. Solar Energy Monitoring
Monitoring and managing solar power generation comes down to managing a handful of components separately: the panels generate electricity, inverters turn it into usable power, and monitoring devices report back on how the whole system’s performing.
Checking each system separately gets tiring and impractical fast. Operators need one single place to see production, equipment condition, and historical performance.
An IoT-based solar monitoring platform can pull together information like:
- Current and daily energy output;
- Inverter operating status;
- Equipment availability;
- Environmental sensor readings;
- Historical production trends;
- Alerts for unusual changes or device failures.
The platform doesn’t automatically diagnose the exact physical cause. What it gives the operator is a signal, plus the information they need to track down the problem faster.
Solar Harmony, a renewable-asset management platform Dinamicka built, is a real-world example of this. It brings solar panels, batteries, and connected sensors together in one interface, with live dashboards, historical data, device controls, and alerts.
5. Battery Storage Management
Battery energy storage systems (BESS) are a solid way to store electricity and use it whenever other sources aren’t available or cost more. IoT plays a big role here too: it can show the battery’s current state, keep historical records, send alerts when something’s off, and manage charging and discharging based on electricity rates, expected solar output, or how much demand there is on site.
That kind of automation needs extra integration work and clearly defined operating rules. A monitoring dashboard on its own can’t make these decisions.
6. EV Charging Management
EV charging is becoming a bigger part of commercial and industrial infrastructure by the day, and with that comes a growing need to manage the electrical load that charging stations put on the grid.
When several vehicles charge at once, the system splits the available power between them. If the building itself starts drawing more power, charging slows down temporarily so the site doesn’t go over its limit.
IoT-based EV charging management systems are already widely used around the world. They pull data from charging stations regularly, track whether they’re available, and coordinate charging sessions.
Systems like these often cover:
- Monitoring the status of individual charging points;
- Tracking the energy delivered during each charging session;
- Managing charging schedules;
- Splitting available power between connected vehicles;
- Flagging charging units that are offline or faulty;
- Tying charging data into the site’s overall energy monitoring.
Hooking this into a building’s energy system or solar management setup makes it even more efficient, since charging schedules can then adjust to the load from other equipment, peak solar output, or cheaper charging rates.
7. Smart Grid Management
Power grids involve a huge number of distributed assets, demand patterns that keep shifting, and equipment spread out across many different locations.
IoT is the backbone of smart grids. It gives grid operators and utilities data from sensors on transformers and power lines, plus smart meters, which makes monitoring and coordinating these networks a lot easier.
Any outages or voltage deviations get reported to operators fast, which narrows down where the fault actually is.
Smart meters and advanced metering infrastructure (AMI) are a key piece of this. They support collecting and sharing usage data between utilities and customers.
Other applications include:
- Monitoring voltage and current across distribution networks;
- Detecting unusual changes in network conditions;
- Tracking transformer and substation equipment;
- Identifying potential equipment issues;
- Supporting outage detection and restoration activities;
- Collecting data from distributed energy resources (DER).
For utilities, integration with existing supervisory control and data acquisition (SCADA) systems is often essential. IoT can extend the available monitoring layer, but it should not interfere with established operational controls.
Dinamicka has already implemented a similar solution in a project that was called N-Smart, an AI-powered asset management platform for utilities. The project focused on bringing utility poles, service trucks, tools, and inventory into a shared operational view, with dashboards and resource tracking.
8. Demand Response and Virtual Power Plants
Demand response (DR) is about adjusting grid consumption based on electricity prices, grid conditions, or other signals. It lets utilities coordinate which loads to shift or cut back.
For example, a commercial site might temporarily ease off on non-critical HVAC settings, or push EV charging to a later time, during a period of high demand.
IoT systems provide the monitoring and communication infrastructure that makes all of this possible.
A virtual power plant (VPP) takes this idea further by coordinating several distributed energy resources at once. These might include solar installations, battery storage systems, controllable loads, and other connected assets.
Even though these resources sit in different physical locations, software can pool their capabilities and coordinate how they operate as part of a broader energy strategy.
A VPP platform might need to pull in:
- Available generation capacity;
- Battery charge state;
- Current and forecasted consumption;
- Device availability;
- Grid or market signals;
- Operational constraints.
The platform then uses all that to work out which resources can respond, and how to coordinate them.
A quick table for weighing up use cases:
Not sure which use case fits first?
Start with the asset that costs you the most in downtime or wasted energy. We’ll help you rank the options against your equipment and budget.
Book a Free ConsultationHow an IoT Energy Management System Works
An IoT energy management system is made up of five links in a chain: devices, connectivity, gateway, platform, and action. Data flows down that chain, and commands, when they’re needed, travel back up it.
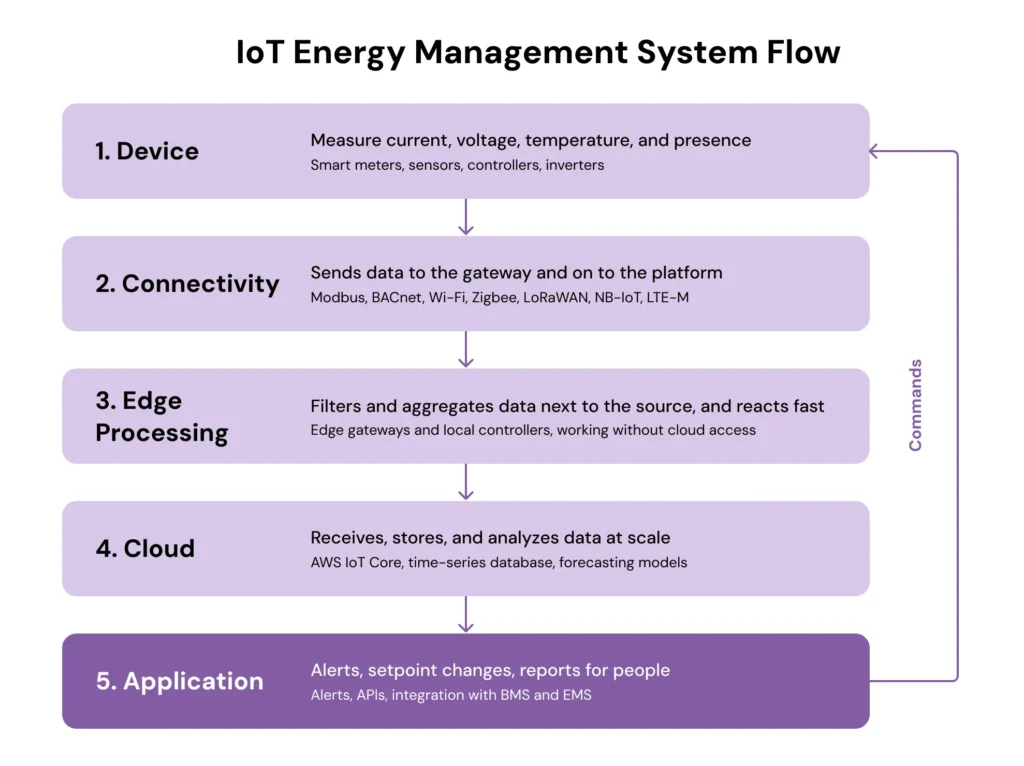
1. Device and sensor layer
This layer is where you’ll find smart meters, current transformers (CTs), and temperature, CO2, and occupancy sensors. This is where physical readings get taken and data gets collected in the first place.
Some devices already have built-in connectivity. Others need extra sensors or adapters bolted on.
2. Connectivity and gateway layer
The data that gets collected makes its way to the software platform through edge gateways. The gateway reads the data off the local bus, converts it, and sends it on over wireless or wired networks.
Depending on the equipment and the setting, data can travel over Wi-Fi, Ethernet, cellular networks, or low-power wireless tech like Zigbee and LoRaWAN.
At the protocol level, you’ll commonly see:
- MQTT: a lightweight messaging protocol, great for IoT because its headers are so small;
- Modbus: a widely used industrial communication protocol;
- BACnet: a protocol commonly used in building automation systems;
- HTTP/REST: tools well suited for exchanging data between applications and services.
A gateway lets you pull together devices that use different connection methods, and pass their data through to one central platform.
3. Edge computing layer
Sending huge volumes of raw data straight to the cloud puts a heavy load on your network connections, and in time-sensitive situations the delay just isn’t acceptable. That’s the problem edge computing is built to solve.
Edge processing keeps the first pass of filtering and aggregation next to the sensors. That way only the data that matters goes to the cloud, and time-critical decisions don’t wait for a round trip.
Not every project needs a complicated edge setup. For a system that’s mostly just pulling periodic meter readings, cloud processing alone might be enough.
4. Cloud and data processing layer
Cloud platforms take in and process these aggregated data sets, making them available for storage, analysis, and feeding into machine-learning models that forecast consumption. Raw, high-frequency readings might sit in cloud storage for 30 days, daily aggregates for up to 12 months, and monthly summaries for up to 3 years, after which they get deleted automatically.
Without some basic structure in place, consistent timestamps, units, and device IDs across readings from different meters, your dashboards can end up showing comparisons that are flat-out misleading.
5. Application and control layer
The end user interacts with the system through a web or mobile app. An energy management app can show live readings, historical charts, equipment status, alerts, and reports. It can also give authorized users controls to adjust connected devices directly.
Ready-Made IoT Platform or Custom Energy Management Solution?
Once a business decides to actually build the system, the question becomes: go with an off-the-shelf product, configure something on top of an existing IoT platform, or commission a custom build?
The answer isn’t in myths about “off-the-shelf is always cheaper” or “custom-built is always better.” It’s in weighing your own needs for flexibility against how fast you need to launch.
In practice, there are three common approaches.
For the second option, there are ready-made foundations out there, like the open-source platform ThingsBoard or the managed cloud service AWS IoT Core for connecting devices. They give you a base to work from, but someone still has to set up the dashboards, rules, and integrations.
Three questions can help you decide faster:
- Does the product support your devices out of the box?
- Can you take your data with you if you ever switch to a different solution?
- Who’s responsible for integrating with your BMS or ERP?
If the answer to all three is yes, an off-the-shelf product will probably do the job. People end up at the third option when neither a product nor a platform can handle their process. At that point you usually need IoT application development and careful integration work, and it’s worth running a short audit before you start, so your IoT energy management solution doesn’t end up costing more than it needs to. We provide a more in-depth comparison of “Build vs. Build” in our article.
Need a platform built around your equipment?
If off-the-shelf software or a configured platform can’t handle your devices or workflows, we design the custom layer. Share your device list, and we’ll tell you what it takes to build.
Get a Custom ScopeChallenges of IoT Energy Management and How to Solve Them
Most of the headaches with IoT in energy management come down to the device itself: connectivity, integrations, data, security, and scale. There are usually five challenges people run into, and each one has a working fix.
Unreliable connectivity
Real-world experience has shown that consumer-grade Wi-Fi just doesn’t hold up for dispatching energy systems, thanks to signal dropouts, configuration changes, and high latency. That’s pushing energy companies toward dedicated cellular links (LTE-M, Cat-1bis) or private 5G networks with store-and-forward support, which does push up connectivity costs.
But some energy assets sit in places where you can’t guarantee a stable connection, or any internet at all. Basement electrical rooms and remote sites, including parts of South Africa or Kenya, can lose mobile signal entirely.
A system that depends entirely on a constant cloud connection can go completely blind the moment that connection drops.
How to address it:
- Use local edge gateways with store-and-forward support (they hold data in local memory while offline and send it automatically once the connection’s back);
- Pick the connection type based on the actual location, instead of just assuming Wi-Fi will be enough;
- Consider cellular tech like LTE-M or NB-IoT where it makes sense;
- Work out which functions need to keep running locally when the connection goes down.
The key is separating what genuinely needs a real-time connection from what can tolerate a delayed update. We built something similar, for vehicles on the road rather than fixed assets, for a Kenyan logistics company as part of a TMS project. You can read more in our case study on it.
Integration with existing systems
Energy companies and facility operators rarely start from a clean technical environment. They may already use SCADA, BMS, EMS, ERP, maintenance software, and equipment-specific applications.
These systems can have completely different interfaces and data formats. On top of that, a lot of sites are still running meters and controllers installed 10 to 15 years ago, with no modern APIs or network access at all.
How to address it: Start with an integration audit to map out which systems are involved, what interfaces are actually available, who owns the data, and which way information needs to flow;
An integration layer lets you standardize the incoming data and tie applications together, without having to rip out and replace your existing infrastructure.
When several systems need to exchange information, integrating with the tools already in place can be done with dedicated APIs and middleware.
Learn more about our API development and integration capabilities.
Data quality and consistency
Sensors can go offline, throw out false spikes, use mismatched timestamps, or send duplicate and incomplete readings. Connectivity drops can also leave gaps in your historical data.
How to address it: Calibration helps, and so does checking incoming data for valid ranges and gaps, plus keeping one consistent time and unit format. Make sure you also check incoming readings and keep an eye on data quality and device connectivity, without skipping that step.
Cybersecurity and operational safety
Energy infrastructure counts as critical infrastructure, and connecting large numbers of IoT devices widens the attack surface, turning every single sensor into a potential way in. That’s a real security risk, especially when IoT applications talk to operational technology (OT) like industrial controllers, building automation systems, and SCADA infrastructure.
A security issue in a regular business app might expose sensitive information. But an incident involving operational equipment can have serious consequences for uptime and people’s physical safety, and that matters just as much as confidentiality does.
The National Institute of Standards and Technology (NIST) covers these requirements in its 2023 publication, NIST SP 800-82 Rev. 3: Guide to Operational Technology (OT) Security.
How to address it:
- Where you can, keep corporate IT networks separate from critical operational technology (OT) environments;
- Use role-based access control (RBAC) even on shared interfaces;
- Use secure TLS 1.2 authentication with certificates for every single device;
- Keep a device inventory and stick to software update policies with tight firmware control;
- Control access and log important system events;
- Test your security procedures before turning on remote control features;
- Define your recovery and incident-response processes.
Security needs to be baked into the architecture from day one, not bolted on later.
Big data management
On top of all that, there’s the challenge of managing big data, along with organizational and regulatory limits. Sensors out at the edge generate terabytes of high-frequency data, and processing it takes serious computing power, plus clear rules for clearing out old traffic.
How to address it:
- Use edge computing for the first pass, filtering out noise and compressing data right at the local gateways near the sensors;
- Set strict rules for automatically aggregating and purging old data;
- Use scalable cloud storage and energy management information systems (EMIS) that let you scale up computing power as needed;
Stuck on connectivity or integrations?
Most rollouts stall at the gateway or the ERP connection, not at the dashboard. We audit your existing systems and map what can be connected first.
Start an Integration AuditHow to Implement an IoT Energy Management Solution
A successful IoT project starts with a business problem, not with a shopping list of sensors or a choice of cloud provider.
The rollout process needs to connect your operational requirements to the technical choices you make. The steps below are a solid practical starting point.
Step 1. Define the business objective
A vague wish to “have an IoT platform” doesn’t tell you anything useful. But a task like “monitor output and status at several solar sites, with alerts when something’s off” already gives you something solid to build requirements from.
Step 2. Audit existing equipment and software
Audit your existing assets and list out every meter, sensor, controller, inverter, battery, gateway, and so on. For each one, note the model, its interfaces and protocols, what it measures and in what units, firmware and connectivity requirements, and any existing software or APIs. Take a separate look at your BMS, SCADA, EMS, and ERP too. That’ll show you what you can reuse, and where you actually need new equipment or integration work.
Step 3. Design the system architecture
Map out the connectivity, gateways, edge processing, cloud, storage, API, and the app itself. Solar monitoring needs a steady stream of telemetry from inverters and batteries. A building app is going to lean more heavily on integration with the existing BMS. Spell out up front how the system behaves without a connection, and what it still runs locally.
Step 4. Choose the platform and technology stack
Your devices, protocols, data volume, and security requirements all shape the platform and stack you end up with. One example setup: MQTT, Modbus, or BACnet for connectivity, AWS IoT Core for device connections, Python or Node.js on the backend, a time-series database for history, React for dashboards, and AWS or Azure for the cloud. These are just examples, the actual stack gets picked to fit your requirements and whatever infrastructure you already have.
Step 5. Develop and integrate the application
Start by building what actually serves the main goal. For monitoring, that means device status, live readings, history, equipment metrics, alerts, device registration, and user roles. Automated rules, reports, forecasting, and remote control get added once the project grows more complex. If the solution needs to tie together network infrastructure, distributed assets, and business systems, you’ll need broader expertise in energy software development.
Step 6. Run a pilot
Use equipment that actually represents your setup, under real conditions. A simulated data feed will prove your dashboard works, but it won’t surface problems with devices or the network. Check:
- accuracy and stability of the readings
- how the system behaves during a temporary connection loss
- whether timestamps and history are correct
- whether alerts are useful and arrive on time
- whether the dashboards actually make sense
- whether integrations with existing systems work properly
- access rights and recovery
Bring in the people who’ll actually use it, because facility managers, engineers, and maintenance staff all expect different things from the software.
Step 7. Measure results and scale gradually
Compare how the pilot actually went against your original goals. If the goal was visibility into consumption, check whether users are spotting patterns they couldn’t see before. If it was equipment monitoring, check whether alerts are giving maintenance staff enough context to act on. Scale up once you’ve hit your acceptance criteria, and new devices, sites, and integrations shouldn’t need a whole new architecture to support them.
Example From Our Work: Battery and Solar Monitoring Platform
Dinamicka worked with a US company that needed an easier way to monitor and manage several renewable-energy devices.
The company was managing a lot of devices at once: solar panels, batteries, sensors. Monitoring everything by hand took time and led to mistakes, so they needed one environment for fast, reliable management.
What Dinamicka developed
We built a web app for managing renewable energy assets called SolarHarmony. It brings connected solar panels, batteries, and environmental sensors together in one interface, with a live dashboard and day, week, and month history views.
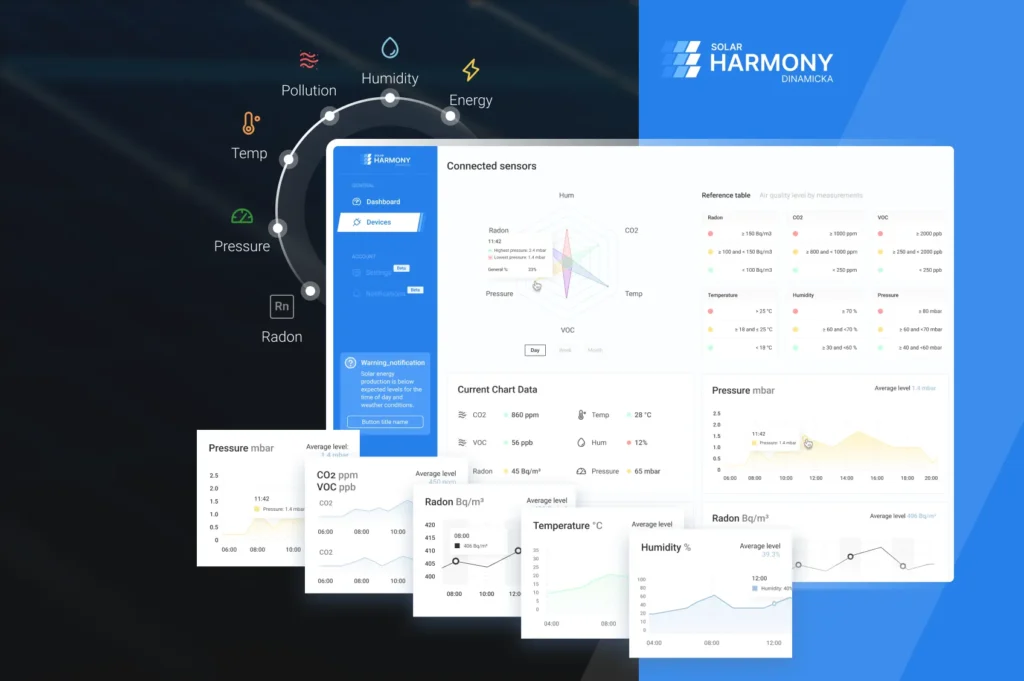
The app’s core features include:
- A live control dashboard with current device readings.
- Historical data by day, week, and month.
- Solar panel efficiency and daily energy output figures.
- Battery information, including hours remaining, temperature, voltage, power, and charge cycles.
- Environmental sensor readings, including humidity, pressure, air pollution, and radon.
- Device registration and management.
- Alerts for equipment issues and unusual changes.
The app also includes visual charts that help users track changes over time, instead of just relying on current readings alone.
What changed for the client
For the client, the practical difference is that every device is now visible in one place, and alerts have replaced manual checks. The same basic idea carries over to other kinds of assets too, though the specific metrics would differ.
You can explore the Solar Harmony renewable energy asset management software case study for more details about the project.
Building an energy monitoring platform?
We build IoT platforms for solar, battery, and utility assets, from the first audit to a live system. Tell us what you need to monitor, and we’ll scope the first version.
Discuss Your ProjectLatest writings
ERP vs MES: Key Differences and When to Extend Your Existing ERP

How AI and Dynamic Routing Cut Costs and Optimize Logistics